Update: The 2019 full Year in Review is out not!
What was the largest eCommerce business which sold so far this year? What did the list price multiples reach? Which niches are the most popular and which sell the quickest? All these questions and more will be answered in our 2019 ½ Year Review.

Introduction
How this report is put together.
Note: Where it’s relevant we refer to market pulse data by the International Business Brokers Association (IBBA). It’s sourced from IBBA and M&A Source members who participate in quarterly surveys. Further details and report can be found here: IBBA Industry Research.
An overview of the numbers!
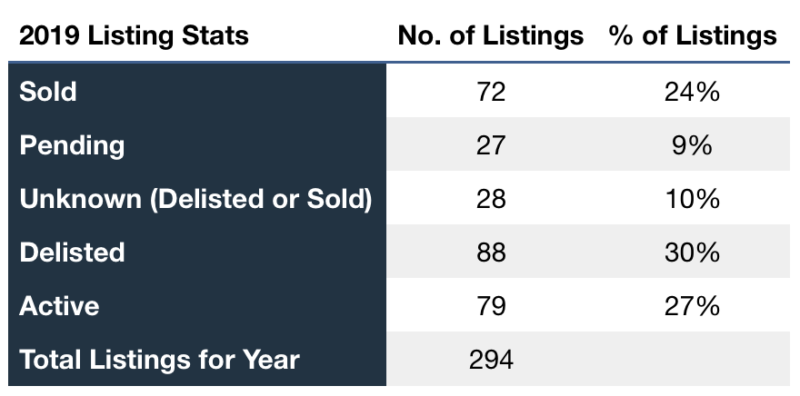
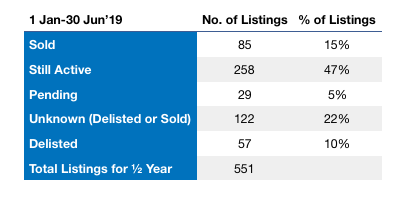
From the 1st of January until the 30th of June 2019 we tracked a total of 551 FBA businesses listed for sale, which is already 61% of ALL businesses listed in 2018 (796). This consists of 257 listings carried over from 2018, plus 294 new business listings we found during the first half of the year.
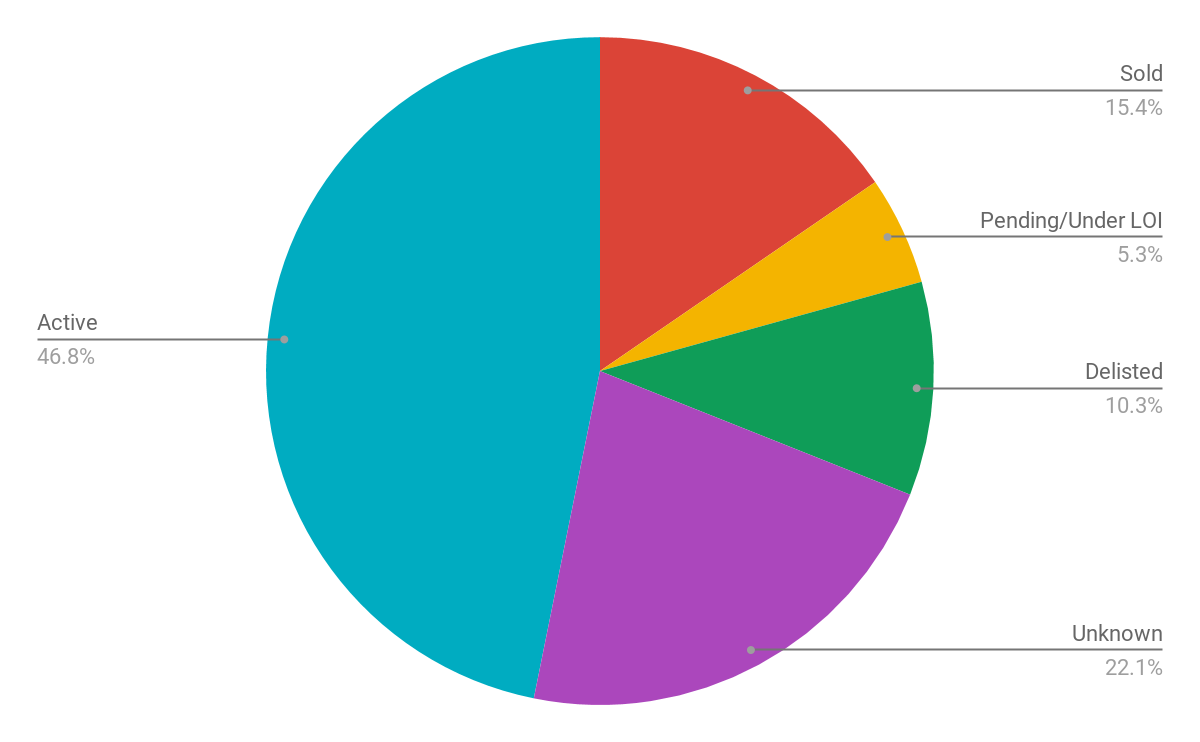
Here’s how the ½ year ended.
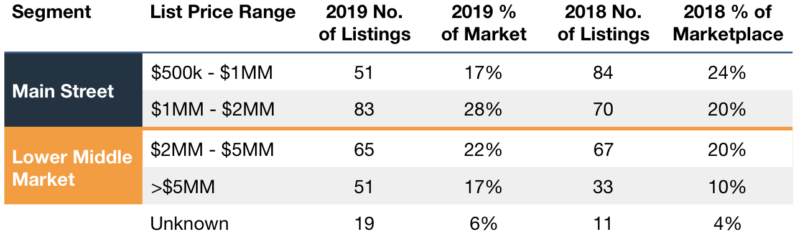
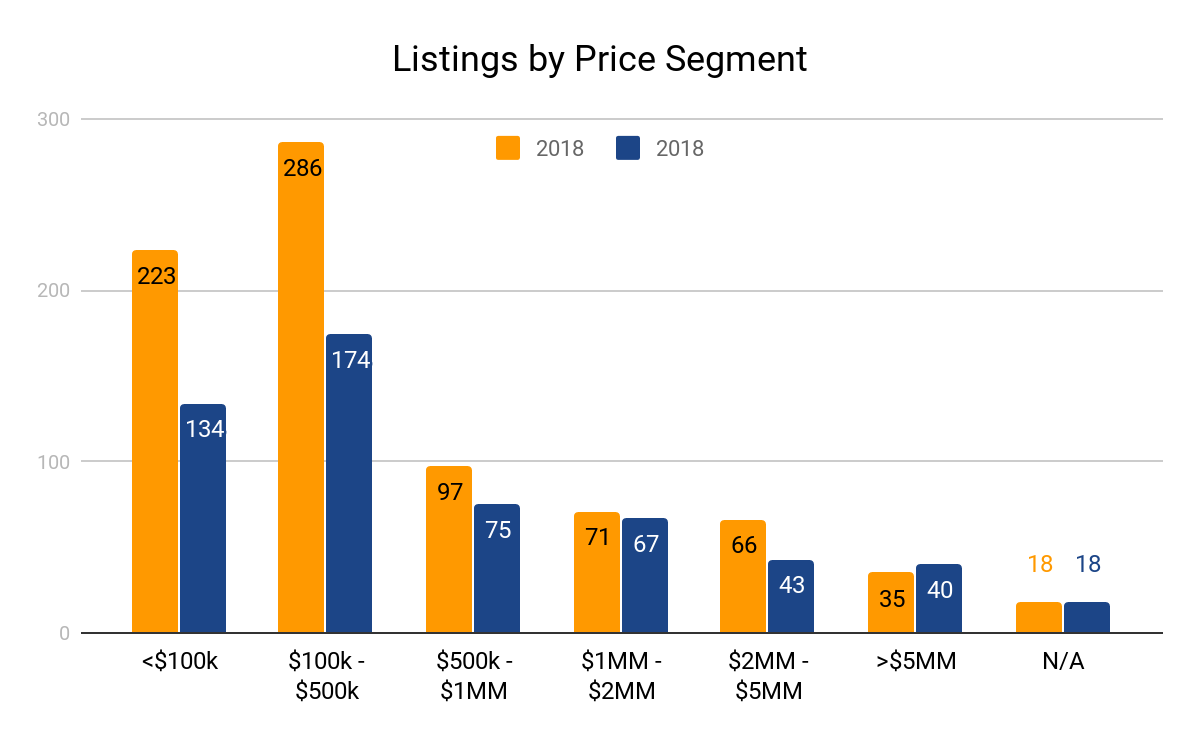
Let’s look at how these 551 listings are breakdown based on the list price. Comparing these figures to those in 2018 might suggest that many sellers have now built a larger business, as the volume of listings >$1MM has increased significantly. Especially if you consider this is only half of 2019.
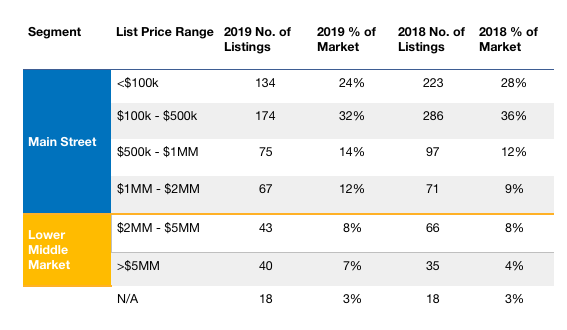
However, there was almost a 50/50 split between business under the $500,000 (56%) and business over the $500,000+ (44%).
Of the businesses listed for sale this year, 39% were noted as doing $1 million or more in revenue (213 of 551). Reported net profits however in this range vary wildly, being anywhere from 1% to 80%. As businesses are generally valued based on a multiple of annual net profit, list prices also fluctuated.
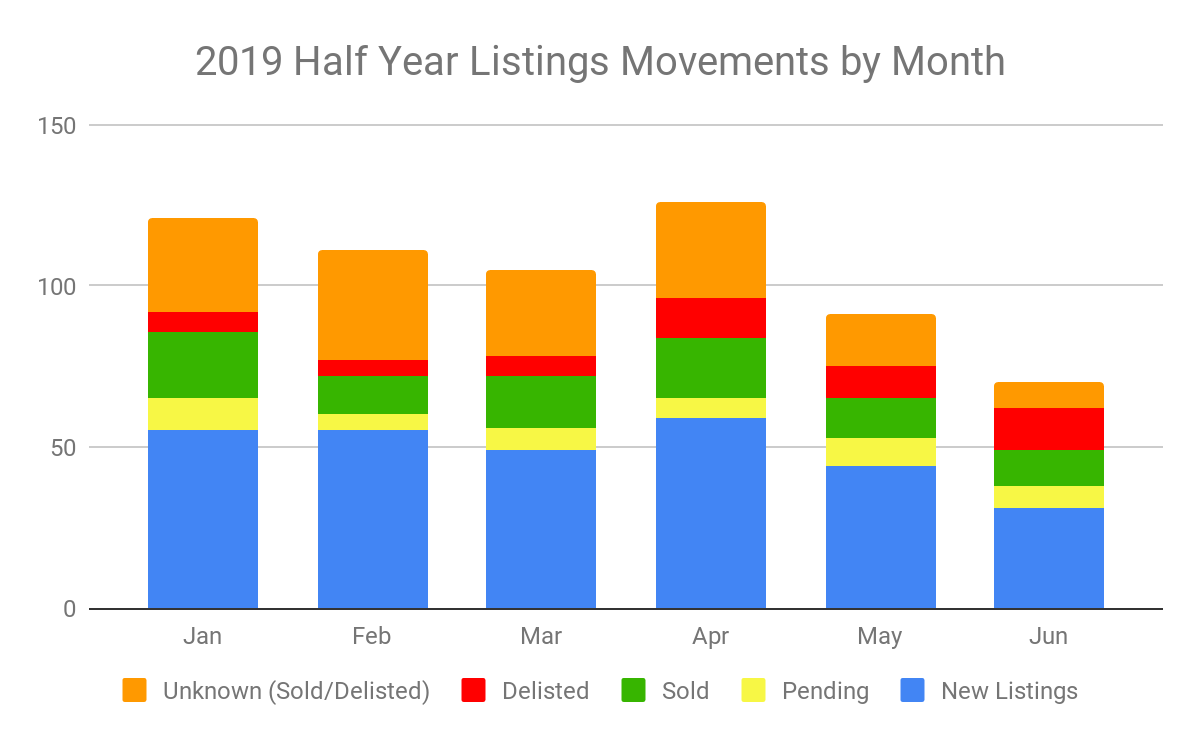
By breaking up the data into calendar months we can see which month has the highest new listings (April) and which month shows the highest amount of sold businesses (January). It’s highly likely that the influx of new listings was spurred on by 2018 tax returns being finally processed, and for the sold deals these are likely carried over from 2018 pending offers which finally processed and closed once the new year swung back into action.
Sold Listings Data
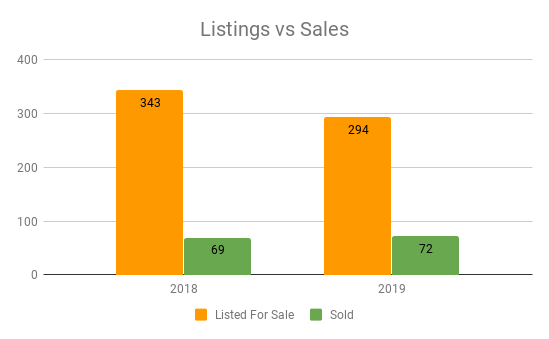
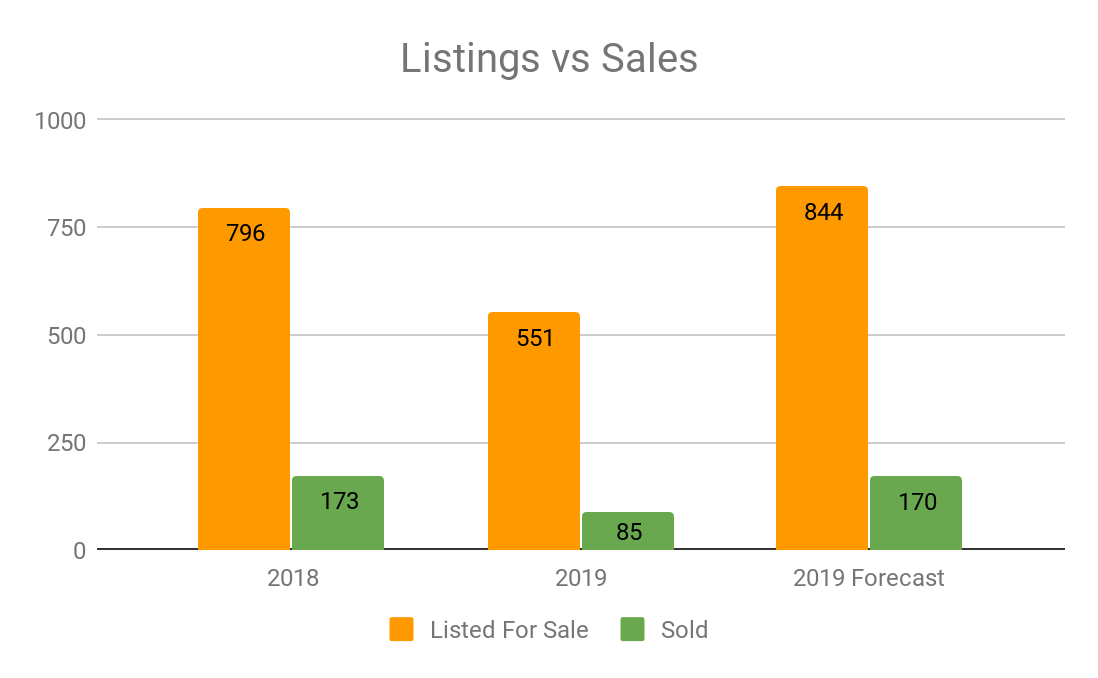
As we see the number of new listings being brought to market increasing year-over-year it poses the question “do these businesses actually get sold”?
If the figures continue to trend as they have done in the first ½ of the year so far, the number of listings that come to market will increase by 38% whilst the number of sold listings will drop by approximately 3 listings.
Despite all the estimations it is difficult to predict what will actually happen in the second half of the year. Especially considering there are 29 businesses that are currently pending.
So far in 2019 we’ve tracked 85 FBA businesses reported as sold which equated to $88.8 million in list price value. Whilst this is a decent volume in transaction value, it’s only 35% of last year’s total of $257MM.
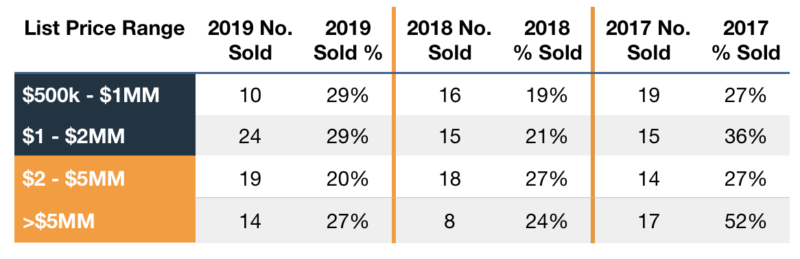
Looking at the sold listings by price segment we can see that the largest businesses, those with a list price over $5MM are expected to exceed last year’s sold amount, with there being 6 pending listings in this price point currently.
We are also seeing an increase in the number of businesses being sold in the $500K – 1MM price point.
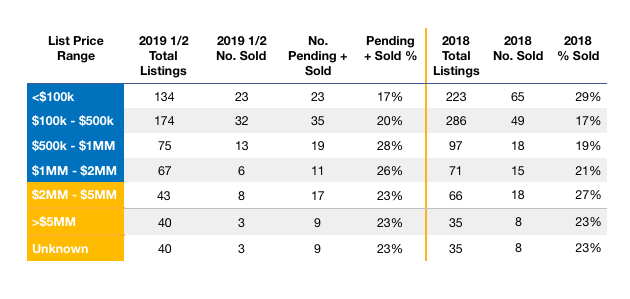
Seeing the lowest percent of sold listings is in the <100K range is interesting and it is closely followed by business in the $100- 500K mark with only a 3% difference. Both of these ranges have more than double available listings resulting in many choices for the buyers who will cherry-pick the best deals. This means many more businesses will go unsold a supply outweighs demand.
Largest Sold Listing
A $16MM supplement business takes the honor of the largest FBA business known to have sold so far this year, 2019. It was listed at a 4.4x annual net profit multiple, selling after 238 days or 8.6 months on the market.
The longer sale time on this deal is not surprising as we are seeing the larger deals increasing in time to close, as we’ll discuss next.
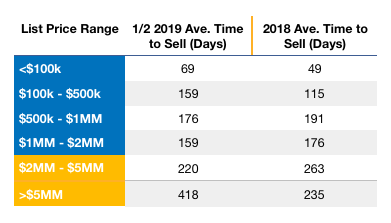
Days on Market
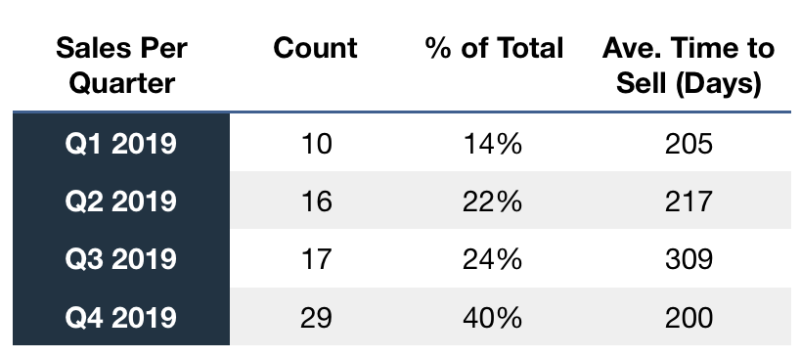
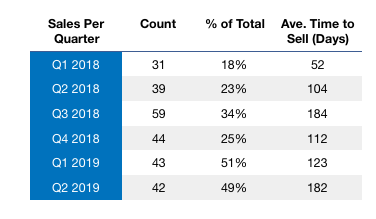
Taking a closer look at the sales by quarter we can see 2 things:
- There is virtually no difference in the number of businesses sold in Q1/Q2 in 2019
- The number of days to sell is significantly increasing year-over-year.
- Compared to the same time last year sales are increasing despite taking longer to sell
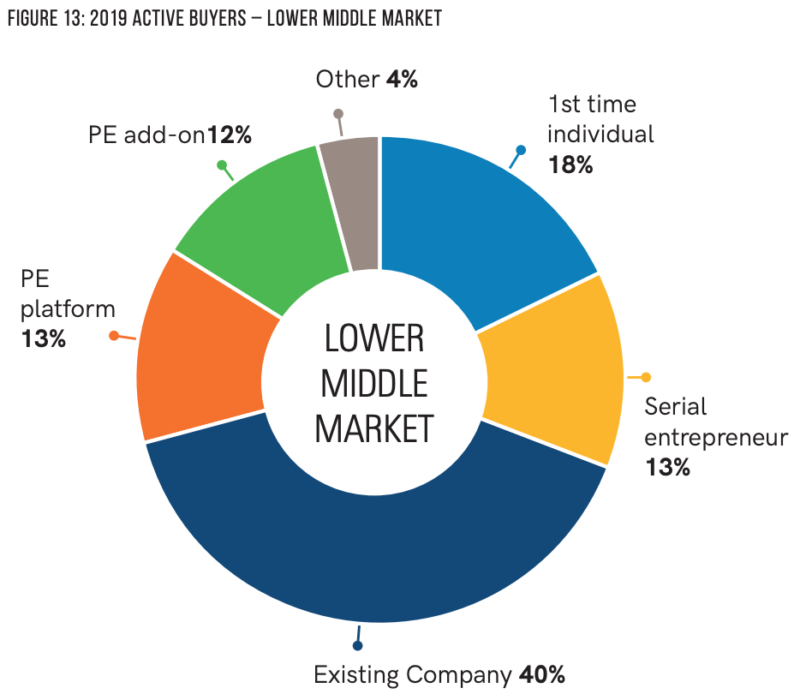
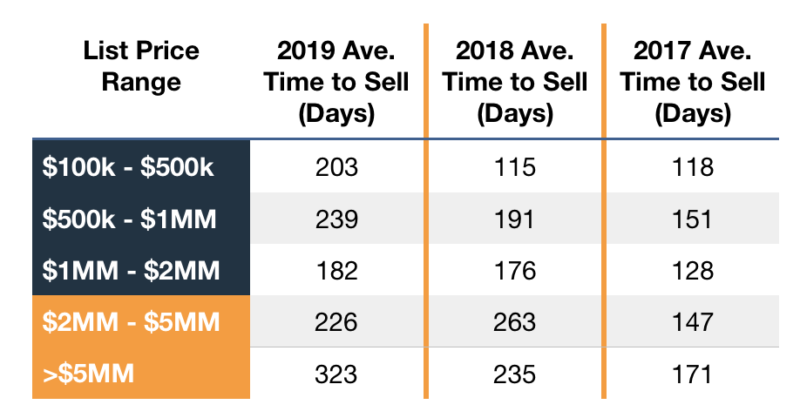
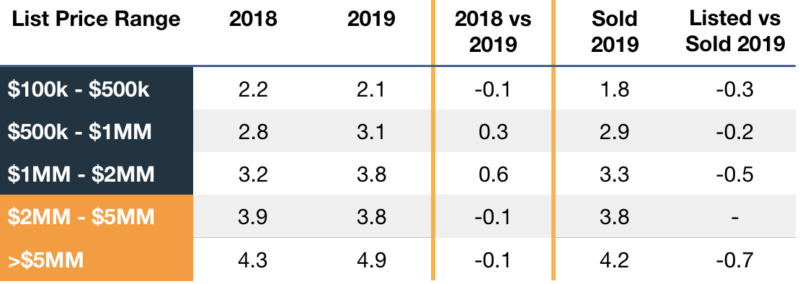
Additionally, the days on market is trending up over time for business >$5MM sized deals alongside deals between $0 – 500K. Whereas it is becoming shorter between the $500k – $5MM price point. This is due to a number of factors in this space such as the number of SBA deals has been increases and buyer expertise in the area (the IBBA reports that 34% of buyers in this price range are serial entrepreneurs).
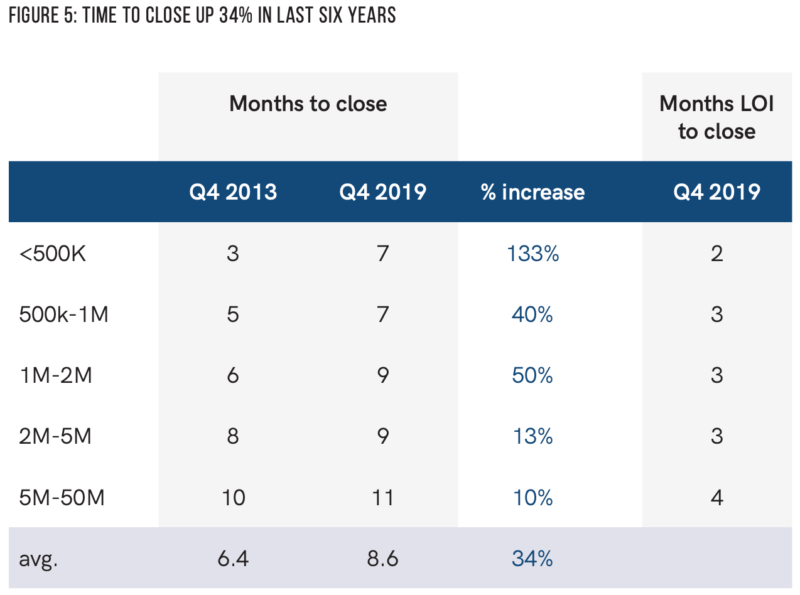
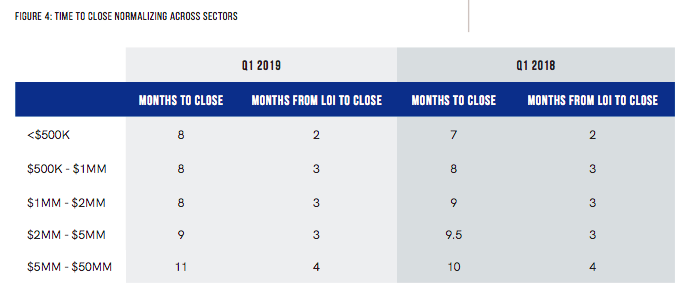
The IBBA also reports that time to close has increased slightly, which is a leading cause as to why deals do not get closed.
“You’ll hear it in our industry again and again: ‘Time kills all deals.’ You need to come to market with well-organized records, realistic expectations, and a committed team who will keep the process moving forward. Anything less can lead to disappointment and ultimately hurt your ability to sell at all.”
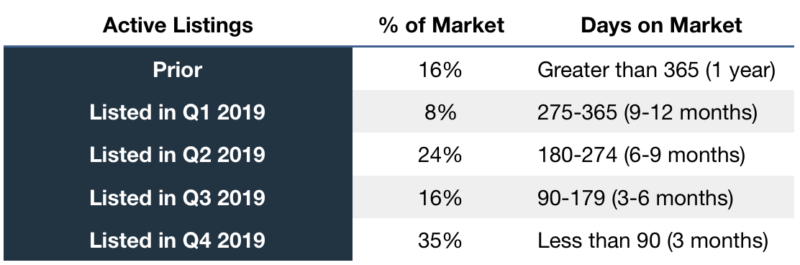
Days on Market for Active Listings
At the beginning of 2019 the marketplace had 230 active listings. Whereas, as of the 1st of July, there were 258 active listings. Of this 56% have been on the market for more than 90 days and only 26% of the active listings were from Q1 2019.
Top Amazon Categories
A lot of entrepreneurs have a goal of one day selling their business for a meaningful amount. Of the 85 sold listings, 22 were listed at $1MM or above, which is where we focus our time. Below are the top 5 Amazon Categories where they likely sold for 8 figures or more based on their list price.
Percentage of Sold Listings by Category
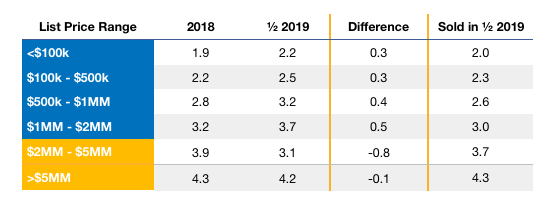
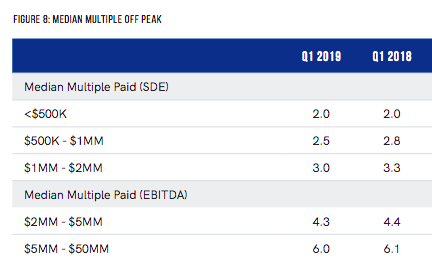
List Price Multiples (active listings)
2019 saw a small increase in multiples across almost all price points. The data also suggests that those businesses which did eventual sell had a slightly lower multiple than what it was listed at.
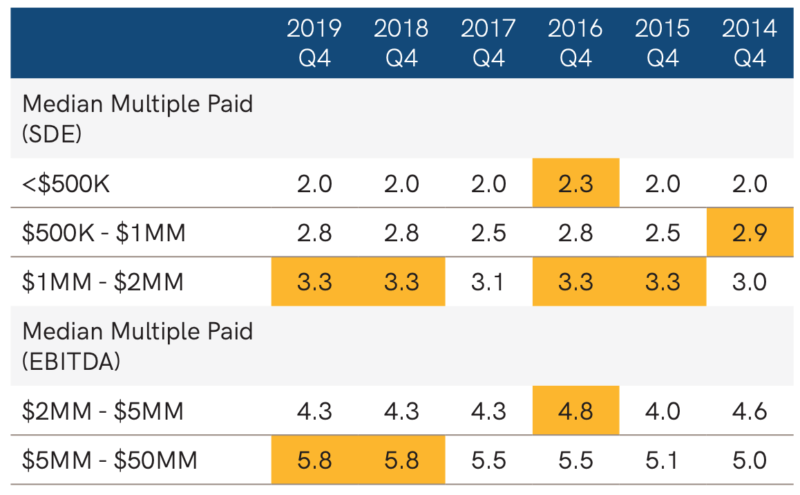
“Multiples continue to remain strong in all categories, although no sector came in at or above peak. The largest market sector reached a median multiple of 6.0, just shy of Q1 last year.
Over the last six years, multiples in Main Street have varied within about a 10% range. However, the lower middle market has variations of 2.5 times that, or roughly 25%.”
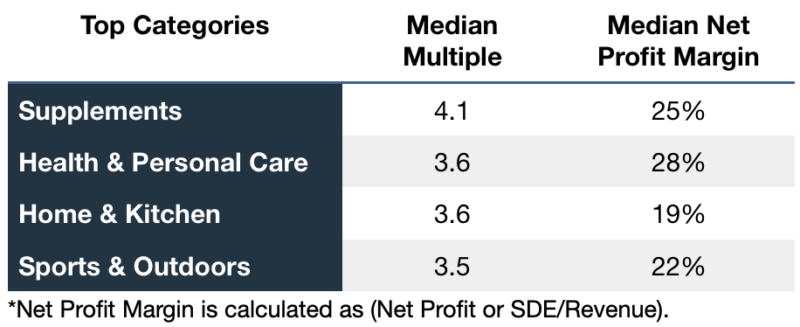
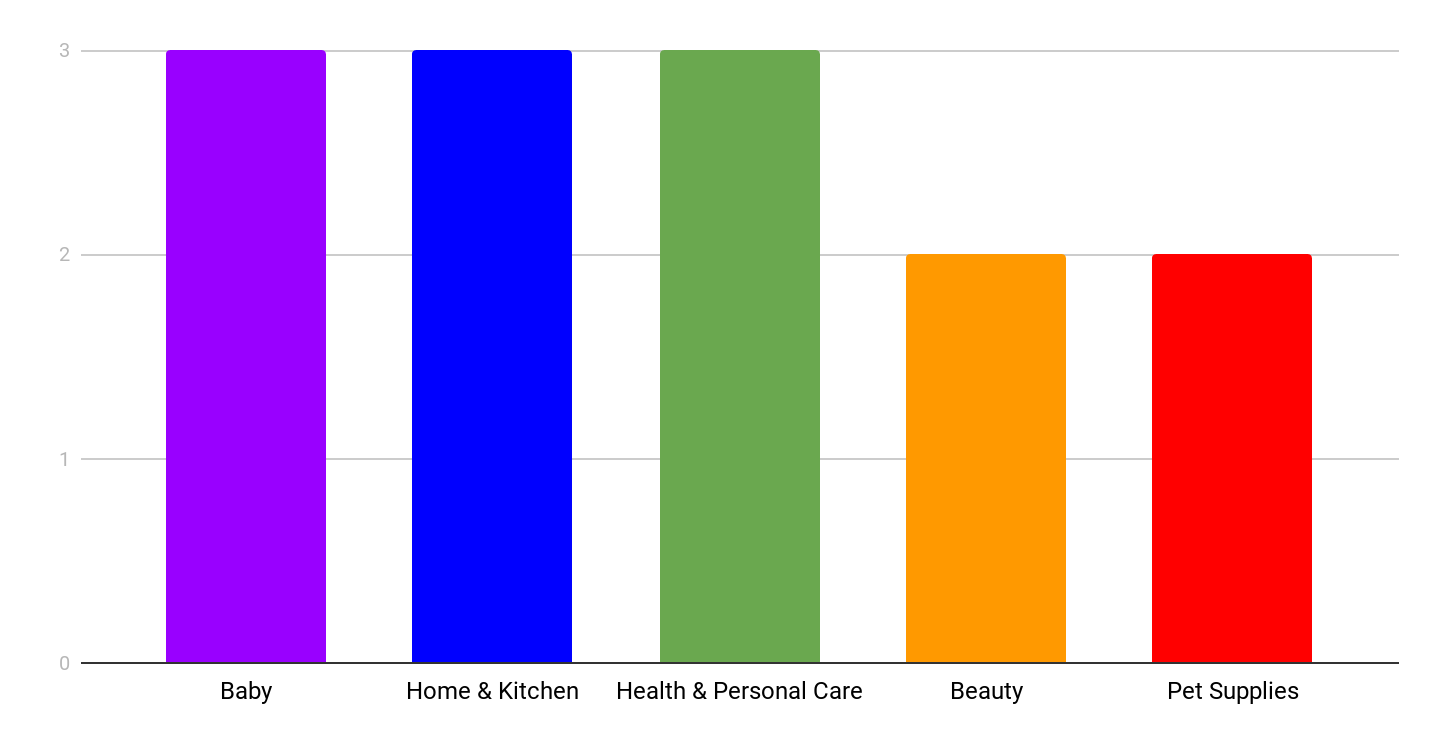
Of the top 5 categories mentioned above here is how they rank in order of highest median multiple of annual net profit. A long way of saying the ones which got top dollar! Beauty achieves the highest median multiple, being 0.8x more than Home & Kitchen brands.
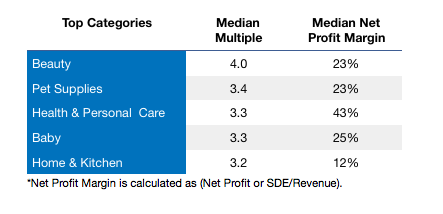
Home & Kitchen comprises of a lot of sub-categories. For our data we use Amazon’s Best Sellers list to categories each listing. You can review the Amazon Best Sellers by departments here.
That’s it for this ½ yearly 2019 review. We’ll be working on category-specific reports so you can see what your niche trends are.